 myagent.mxBLOG
apis & sending · email metrics dashboard
Developers: Six API backed panels for an email metrics dashboard
Developer-focused, operational playbook for agent mailboxes. Maps six API backed panels to exact endpoints, queries, and alert rules so teams detect...
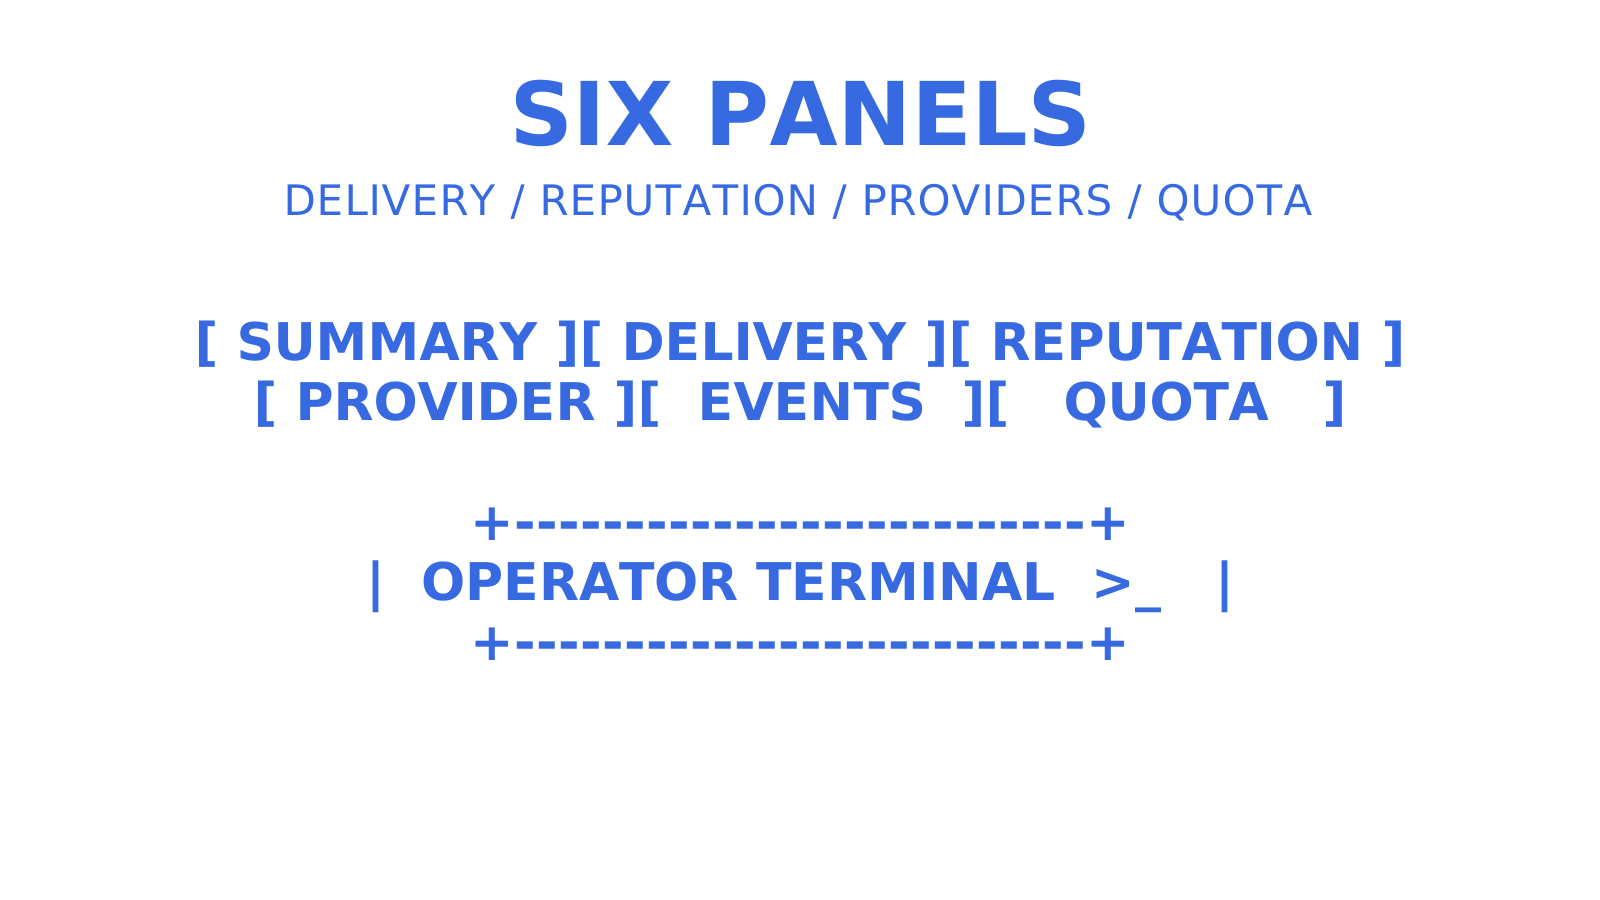
An operational email metrics dashboard for agent mailboxes is a live view of delivery, reputation, provider health, and quota data pulled straight from your mailbox API, not a marketing panel of opens and clicks. At minimum it needs six panels: per-mailbox summary, delivery overview, reputation snapshot, provider health, recent delivery logs, and quota usage. Every one of those panels should be queryable through time-series and event endpoints, not hardcoded from a batch export.
TL;DR
- Having thresholds for bounce and complaint rates helps detect deliverability issues early and trigger immediate alerts before account suspension or throttling occurs.
- Usage endpoints and time-series APIs should be polled with the documented
window,granularityand date parameters, so trends stay accurate across all mailboxes. - Every panel must rely on the correct API endpoint, with query constraints like sorting, pagination, and scope filtering to maintain reliable, real-time operational insights.
- Implementing secure, scoped credential access and single source monitoring ensures accurate metrics and isolates failure points during incidents.
- Building the dashboard in logical order — fetching mailbox usage, then time-series data, followed by recent event logs — improves data consistency and operational response accuracy.
Table of Contents
- What panels does an email metrics dashboard need?
- Which APIs power each dashboard panel?
- How do you catch deliverability regressions early?
- How do you implement the dashboard queries step by step?
- How do you secure metrics in a multi-tenant dashboard?
- Why mailbox-first metrics matter for agent reliability
- Try an agent mailbox with metrics built in
- Sources
- FAQ
What panels does an email metrics dashboard need?
Six panels cover the operational reality of an agent mailbox. Miss one and you’re flying blind on either delivery, reputation, or capacity.
- Per-mailbox summary: last activity timestamp, storage used, message counts from thread listings, and suspend status. This is the panel an operator checks first when an agent reports “email isn’t working.”
- Delivery overview: total, sent, failed, rejected and pending counts from the metrics summary, alongside delivered, bounced, complained, rejected and delivery-delayed events. Read together, these numbers tell you whether outbound is healthy or quietly degrading.
- Reputation snapshot: bounce rate, complaint rate, and any blocklist indicators. Analytics APIs typically expose these as computed rates alongside raw counts, drawn from delivered, hard-bounced, and complained totals over a rolling window, per the Analytics API reference. For complaints, Google’s sender guidelines give the reference numbers: keep Postmaster Tools spam rates below 0.10% and avoid reaching 0.30%, and Yahoo asks senders to stay below 0.3%. No major provider publishes a numeric bounce threshold, so a few percent bounce is a conventional internal warning line rather than a published limit.
- Provider health: per-provider success rate, latency percentiles, and quota consumption. If an agent sends through Gmail OAuth, Microsoft 365, and a managed SES fallback, this panel is what tells you which one is quietly failing.
- Live event feed: a scrollable list of recent delivery events with quick links into message-level detail and webhook delivery status, so you can drill from a spike straight down to the failing message.
- Quota panels: hourly and daily accepted-recipient consumption against plan limits, plus storage by mailbox. Usage endpoints return named usage resources per mailbox, each with a
usedvalue,hard_limit,soft_limit,warn_limit,percent_usedand alimit_status, per the Mailbox API usage endpoint.
Skip any of these six and you lose a category of failure. Skip reputation and you find out about a blocklisting from a support ticket. Skip quota and an agent silently stops sending mid-afternoon because it hit a daily cap nobody was watching.
Which APIs power each dashboard panel?
Every panel above maps to a specific endpoint shape, and getting the parameters right matters more than the visual design.
- Time-series endpoints handle the delivery overview and reputation trend charts. The Sendmux metrics endpoint takes a
windowof24h,7dor30d, or explicitfrom_dateandto_datevalues, with agranularityofhourlyordailysetting the bucket width, while the mailbox events stream carries anevent_typesfilter to isolate bounces or complaints from the full feed.
Time-series APIs commonly cap how much data one query can return, so a long hourly query may need pagination or a coarser granularity, per Cloudflare’s GraphQL Analytics limits.
2. Usage endpoints feed the per-mailbox summary and quota panels. They return named usage resources scoped to a single mailbox, with used, hard_limit, soft_limit, warn_limit, percent_used and limit_status fields, and the response semantics are cumulative rather than delta, so your dashboard should snapshot and diff if you want a “growth this week” figure.
3. Event and delivery-log endpoints back the live feed and drilldown view. Webhook events carry a message ID, an event type (message.delivered, message.bounced, message.complained, message.rejected, message.delivery_delayed) and timestamps, while delivery logs add a status of pending, sent, failed or rejected with a status_reason, mirroring the status and error-cause grouping Cloudflare’s Email Service analytics exposes.
4. Query constraints matter in production. Clamp any requested to_date to “now,” respect response limits on time-series calls, and always fetch recent events with an explicit limit and cursor.
For most dashboards, granularity=hourly covers ops views and window=7d or window=30d covers trend charts. Both come out of the same metrics endpoint, so there’s no separate reporting pipeline to maintain.
How do you catch deliverability regressions early?
Set thresholds before you need them, not after a mailbox gets suspended.
Beyond the numeric thresholds, run active health checks rather than waiting for a webhook to fail silently:
- A dedicated
/health/emailendpoint that verifies stored credentials still authenticate, confirms each connected provider is reachable, and checks that your webhook receiver is actually accepting and acknowledging deliveries, following the pattern in CronAlert’s monitoring guide. - DNS and certificate monitoring for SPF, DKIM, and DMARC records, plus SSL expiry on your receiving endpoints. Authentication records rot silently after domain changes.
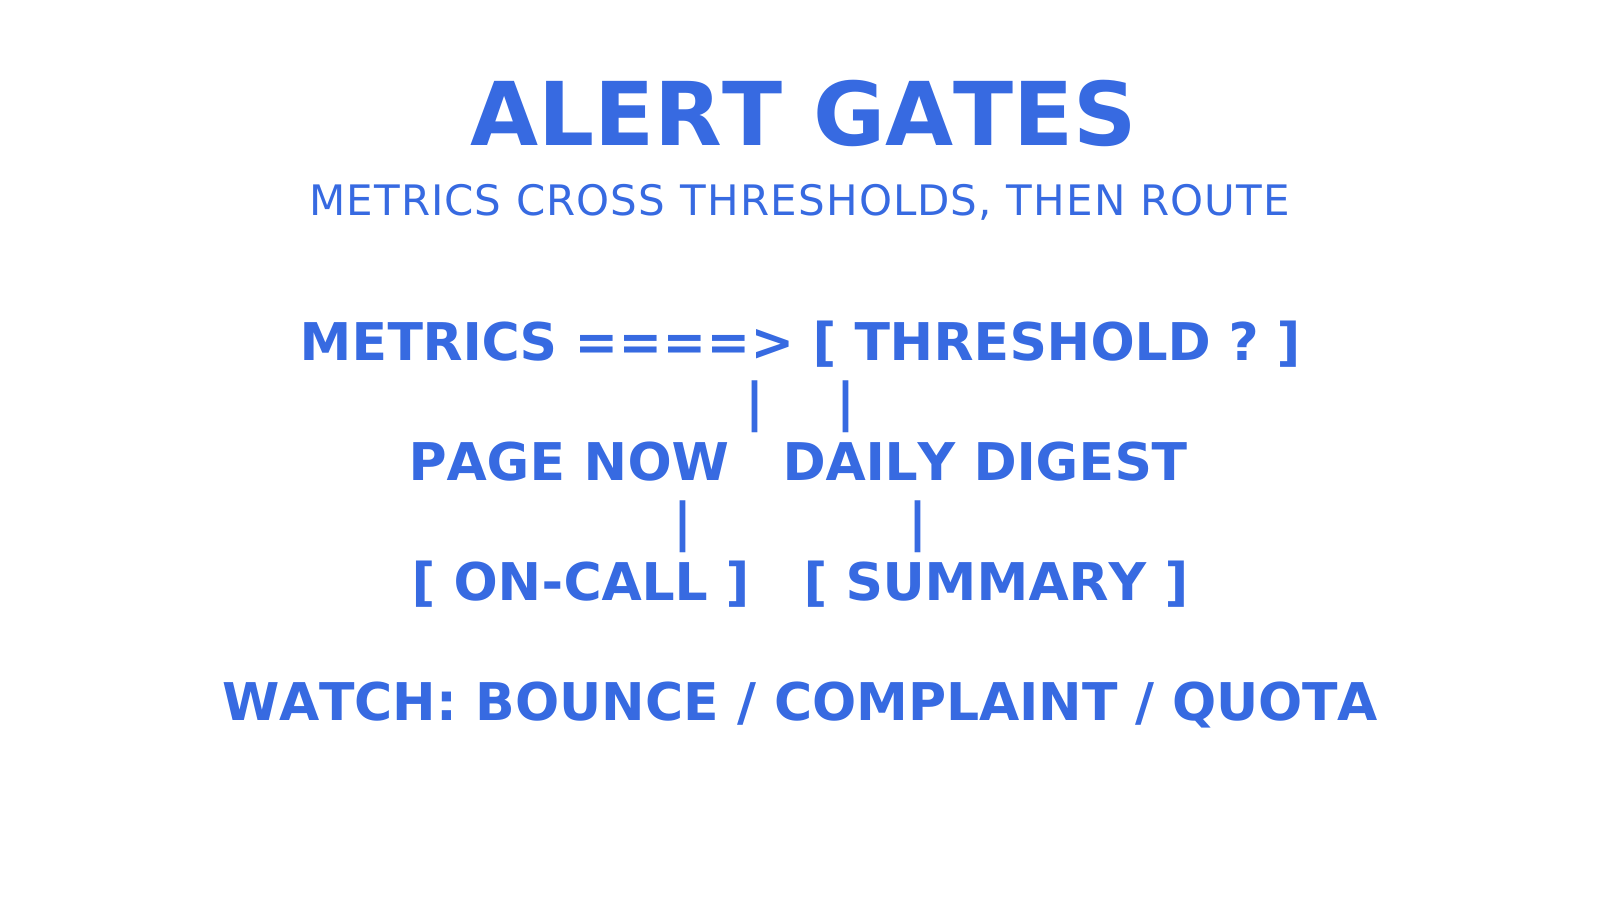
- Alert routing split by severity: page on-call immediately for a bounce-rate breach or a provider going unreachable, but batch trend shifts (slowly climbing latency, a mailbox nearing storage capacity) into a daily digest.
- An operational playbook for when an alert fires: pause outbound sending on the affected mailbox or provider, pull recent delivery logs filtered by
errorCause, and clean the suppression list before resuming.
Pro Tip: Wire your reputation alert and your health-check endpoint to the same underlying analytics query. If the dashboard chart and the automated monitor read from two different code paths, they will eventually disagree, usually during an incident when you can least afford it.
Reputation metrics deserve their own monitoring discipline beyond the dashboard. A deliverability monitoring guide for technical teams is worth keeping alongside your alert config.
How do you implement the dashboard queries step by step?
Build the dashboard in the order the data actually depends on itself, not in the order the panels appear on screen.
- Fetch mailbox usage first. Pull the usage resources for every mailbox in scope — quota
usedvalues againsthard_limit— and the message counts from thread listings. This populates the summary panel and gives you the denominator context for everything downstream. - Fetch time-series delivery buckets next. Request
granularity=hourlywith a24hwindow for an operational view, orwindow=7d/window=30dwith daily buckets for trend charts, using the same metrics endpoint for both the dashboard chart and any automated alert, per Cloudflare’s shared analytics approach. - Pull recent events for drilldown. Use a counts endpoint for the headline totals and a separate limited, descending events query for the scrollable feed, so a click on any spike in the chart opens the matching event list.
- Compute rates client-side, from the same raw counts every time.
bounceRate = hardBounced / delivered * 100andcomplaintRate = complained / delivered * 100, mirroring the reputation calculation approach in the Unsent analytics reference. Never trust a pre-computed rate you can’t reproduce from raw numbers. - Aggregate server-side once you have more than a handful of mailboxes. Cache the usage and time-series responses for a short window and paginate with a token rather than an offset, since a dashboard covering hundreds of agent mailboxes will otherwise re-fetch identical data on every refresh.
For the charts themselves, align bucket timestamps across every series you’re overlaying, so a delivery-rate line and a complaint-rate line share the same x-axis. Compute latency as percentiles (p50, p95, p99) rather than averages, since a single slow provider call skews an average far more than a percentile. Offer a filter by provider and by mailbox on every chart. Without it, a team running 50 agent mailboxes across three providers can’t isolate which combination is causing a spike.
How do you secure metrics in a multi-tenant dashboard?
Metrics access should follow the same credential boundaries as everything else in your API. A root-level key with team-wide visibility has no business being embedded in a dashboard an agent can query directly; scope it down.
- Match dashboard permissions to credential type: root keys for team-wide metrics, mailbox-scoped keys for single-inbox views, and agent tokens limited strictly to their granted scopes.
- Enforce tenant isolation at the query layer, not just the UI. Every metrics call should filter by team scope server-side, with role-based visibility controls on who sees raw logs versus aggregated counts.
- Verify every inbound webhook’s HMAC-SHA256 signature before trusting its payload, and surface delivery attempts, status, and latency in the dashboard rather than assuming silent success.
- Show agents a quota-remaining number, never a raw key or credential value, and rotate or mask any key fragment that does appear in a UI.
- Log every metrics query for audit purposes, and set a retention policy on event logs that matches your compliance needs rather than keeping everything indefinitely by default.
Why mailbox-first metrics matter for agent reliability
Marketing dashboards answer “did this campaign work.” An agent mailbox dashboard has to answer a harder question: is this specific inbox, right now, capable of sending and receiving reliably? That’s a persistent-state problem, not a campaign-reporting problem, and it needs event streams and per-mailbox quotas that most marketing tooling was never built to expose.
In practice, the trade-off that surfaces fastest is polling versus event delivery. Polling a usage endpoint every few seconds burns quota and adds latency; a webhook or SSE stream gets you the same signal the moment it happens, at a fraction of the cost. Storage sizing and event retention windows are the two decisions teams underestimate until a mailbox fills up mid-incident.
Try an agent mailbox with metrics built in
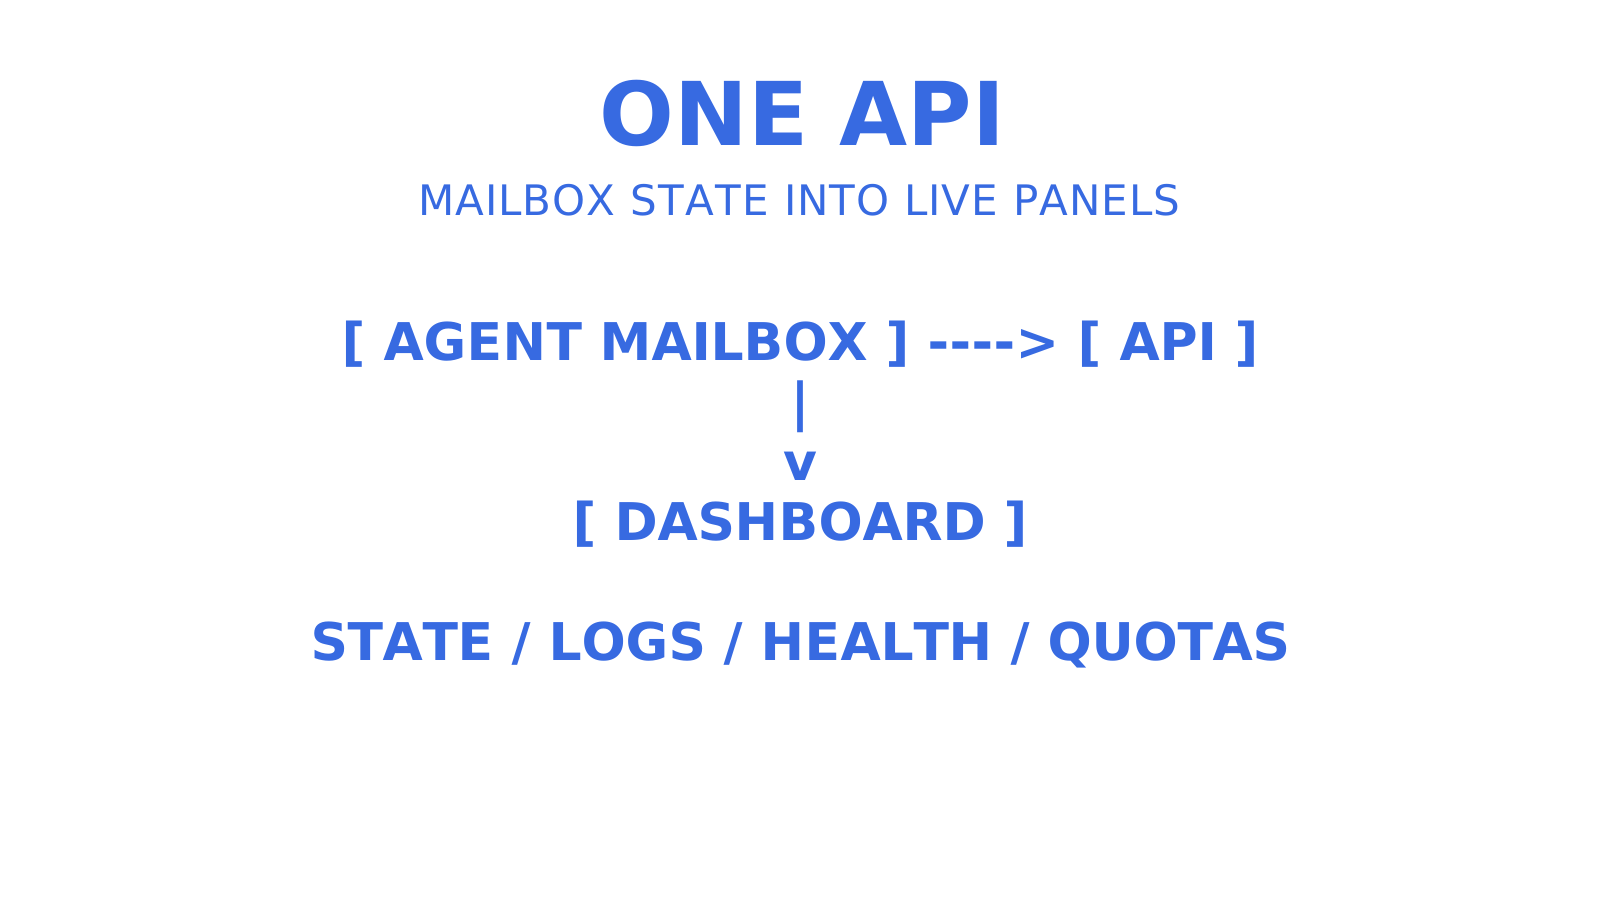
If you’re designing this dashboard from scratch, it’s worth trying a platform where the panels above already map to live endpoints instead of a spreadsheet you rebuild every quarter. Some platforms give every agent mailbox persistent state, delivery logs, provider health, and quota data through one API, priced on usage rather than per seat or per inbox, so a fleet of 50 agent mailboxes doesn’t carry 50 separate line items.
An agent can self-register a free mailbox through Myagent in the session it needs one, with no card and no human signup to get started; after provisioning it can read and receive mail, with sending unlocked once the invited owner accepts and explicitly approves it. From there, the Sendmux product documentation covers the API and OpenAPI references for wiring metrics into your own dashboard. Create the mailbox, run a few sample metrics and usage queries against it, then point your webhook receiver at the events feed and confirm your alert thresholds fire the way you expect before you scale to production traffic.
Sources
- Analytics API reference (Unsent)
- Cloudflare Email Service metrics and analytics
- How to monitor email sending and deliverability (CronAlert blog)
FAQ
What’s the difference between an email metrics dashboard and an email marketing dashboard?
An email metrics dashboard for agent mailboxes tracks operational data: delivery status, bounce and complaint rates, provider health, and quota usage. A marketing dashboard tracks opens, clicks, and campaign conversions, which is a different data set built for a different job.
What bounce rate should trigger an alert?
A bounce rate above a few percent is a widely used internal threshold for flagging deliverability trouble. For complaints, use the published figures: Google’s sender guidelines say to keep Postmaster Tools spam rates below 0.10% and never reach 0.30%, and Yahoo asks senders to stay below 0.3%. Both should page immediately rather than wait for a daily digest.
Which API parameters control time-series bucket size?
The granularity parameter sets bucket width: hourly or daily. Combine it with a window of 24h, 7d or 30d, or explicit from_date and to_date values. To isolate specific delivery outcomes, use the event_types filter on the mailbox events stream.
How much does Sendmux cost for tracking these metrics?
Sendmux’s current pricing is listed on its pricing and product page, including a free tier and usage-based plans. There are no per-seat or per-mailbox fees on either plan.
What usage metrics should a per-mailbox panel show?
At minimum, show storage and quota consumption from the usage resources — used, hard_limit, percent_used and limit_status — and message counts from thread listings. Pair those with last-activity timestamp and suspend status for a complete operational snapshot.
Give an agent its own address
Sendmux is the Email Inbox API for AI Agents.